The Best & Worst Subway Lines In NYC, Ranked
Sept. 17, 2015, 3:42 p.m.
The 7 train rules; the B and 5 trains drool, according to the group.
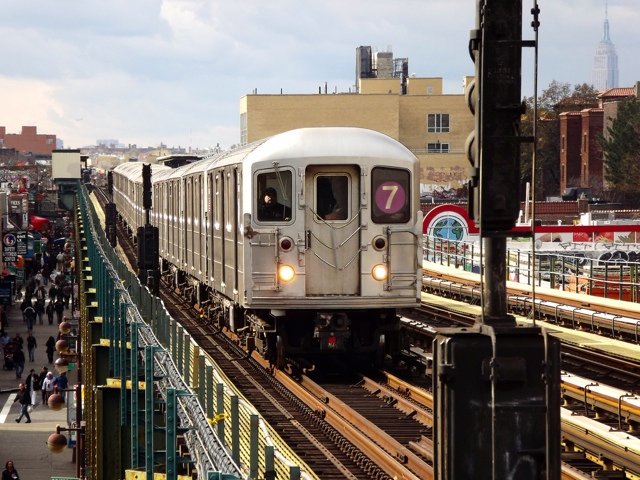
The B and 5 are the worst-functioning subway lines in the city, and the 7 is the cream of the crop, according to a report by the Straphangers Campaign, an arm of the New York Public Interest Research Group. The organization distilled transit data from 2014 to evaluate 19 lines on the basis of cleanliness, breakdown frequency, chance of getting a seat, amount and regularity of service, and clarity of announcements.

The 5 had the most frequent service disruptions of any line, operating on time only 67 percent of the time, and also scored below average in breakdowns and seat availability during rush hour. The B tied the 5 in the group's formula, performing under par in service frequency and breakdowns, and worst in terms of audibility of announcements, logging garbled or absent announcements nearly a quarter of the time.
The 7, meanwhile, may be having some trouble this week, and its stations were recently rated in the worst repair of any in the system by another group. But the service is top-notch(!), NYPIRG's analysts swear. Specifically, the 7 had a near-perfect (98 percent) cleanliness score, and had the most frequent service. It also broke down less and was less crowded than average.
The L train ranked as the system's dirtiest, with 13 percent of its cars deemed gross, but despite the constant complaining about it, it still came in at number 5 overall, making it a quantifiably top-shelf subway line. Considered altogether, the system's trains became more breakdown-prone in 2014, running 7.9 percent less distance between breakdowns compared to the prior year. The year 2013 also saw an increase in breakdowns. However, an MTA spokesman said the trend began to be reversed this year, according to 12-month data through July.
The MTA disputed other aspects of the report in a statement by spokesman Kevin Ortiz:
We are baffled by the report's findings on "chances of getting a seat." The report states that riders have the best chance of getting a seat during rush hour on the F (67%) followed by the 7 (59%) and only a 31% chance of getting a seat on an R train. Our numbers show that the F is operating at about 90% capacity and the R is about 75%. Also, on the 7 line, we are operating about 90% on the 7 local and about 100% capacity on the 7 express.
While some of the report's findings make sense others do not. For example, we provide a level of service on lines based on ridership. The 6 and 7 have the most scheduled service because they are two of our busiest lines. The B sees less service because it carries less than half of the customers the 6 does on a given day. It also makes sense that the 5 would rank lower on regularity of service (what the MTA refers to as wait assessment) due to extensive state of good repair work in the Bronx that included the replacement of track panels and an interlocking at E 180 St.
Anecdotally, which is a way of beginning a sentence that statisticians hate, the B train is a smooth and super-express ride that I've seldom had trouble finding a seat on, so the frequency with which it arrives seems pretty well-tuned. Also, this morning, hobbled by a flat tire, I tried to take my bike on the F train at Bergen around 9 and had to wait until two trains passed before I could squeeze onto the third.
Anyhow, the Straphangers Campaign responded to the MTA's sniping with a statement demanding more and better data analysis:
Transit officials can huff, and they can puff, and they can even report different results for the same measure of performance. But they can't lay a glove on the credibility of 17 years of Straphangers Campaign ratings and rankings. If the MTA were really serious about being transparent, the agency would clean, analyze and pulish the wealth of service data that it is now sitting on. And do it in a way the average rider can access and understand.
Zing. At least both parties are clear on one thing: the MTA's five-year capital plan desperately needs funding. Gov. Cuomo and the MTA he controls have lately taken to demanding Mayor de Blasio fill a $3.2-billion gap in the plan's money stream with city taxpayer dollars. Meanwhile, Cuomo is declining to specify where his $8.3-billion pledge is coming from.
NYPIRG didn't rank the G train, shuttle trains, or Staten Island Railroad, but obviously people depending on those to get around have bigger problems than a wonky announcement or a stray chip bag.